Welcome to pycoxmunk’s documentation!
pycoxmunk: A library for estimating sea surface reflectances
pycoxmunk is a python library that estimates sea surface reflectance using the Cox-Munk method. It is designed for use in areas of open water and may not provide accurate results in coastal regions, for rivers or for lakes. pycoxmunk is designed to be flexible, supporting a wide range of satellite sensors and allowing the inclusion of surface wind speeds to simulate the effects of white caps and other wind related wave effects
A spectral database of water properties is included, allowing pycoxmunk to operate across the visible and near-infrared spectrum from approx. 450 to 3700nm. For wavelengths in the shortwave infrared, however, care must be taken as some of the actual signal measured by a satellite will be from the thermal infrared emission of the water surface. pycoxmunk only handles solar reflectance.
This library is designed to work in tandem with the satpy library that reads data from a wide variety of satellite sensors. However, users who do not with to use satpy can also generate input data for pycoxmunk themselves. pycoxmunk also uses the dask library to enable efficient computation while minimising memory overhead for users operating on smaller machines such as laptops. Dask cna require some tuning for optimal use, so please read the quickstart section on this if you encounter memory or processing time problems.
The pycoxmunk code is open-source and available on GitHub. Pull requests to add new features, improve accuracy, fix bugs, etc are more than welcome. You can also ask questions and raise bug reports via the issues tab on the GitHub page.
New users should refer to the quickstart documentation, while more advanced users can refer to the API documentation and the technical description of the correction method used in SMACPy.
An example of _pycoxmunk_’s capabilities is shown below. This image shows Meteosat Second Generation (MSG) / SEVIRI data over land and _pycoxmunk_ computed sea surface reflectance over water. It is produced by combining results from SEVIRI’s 0.6, 0.8 and 1.6 micron channels as an RGB composite. Wind data was retrieved from the ERA5 archive.
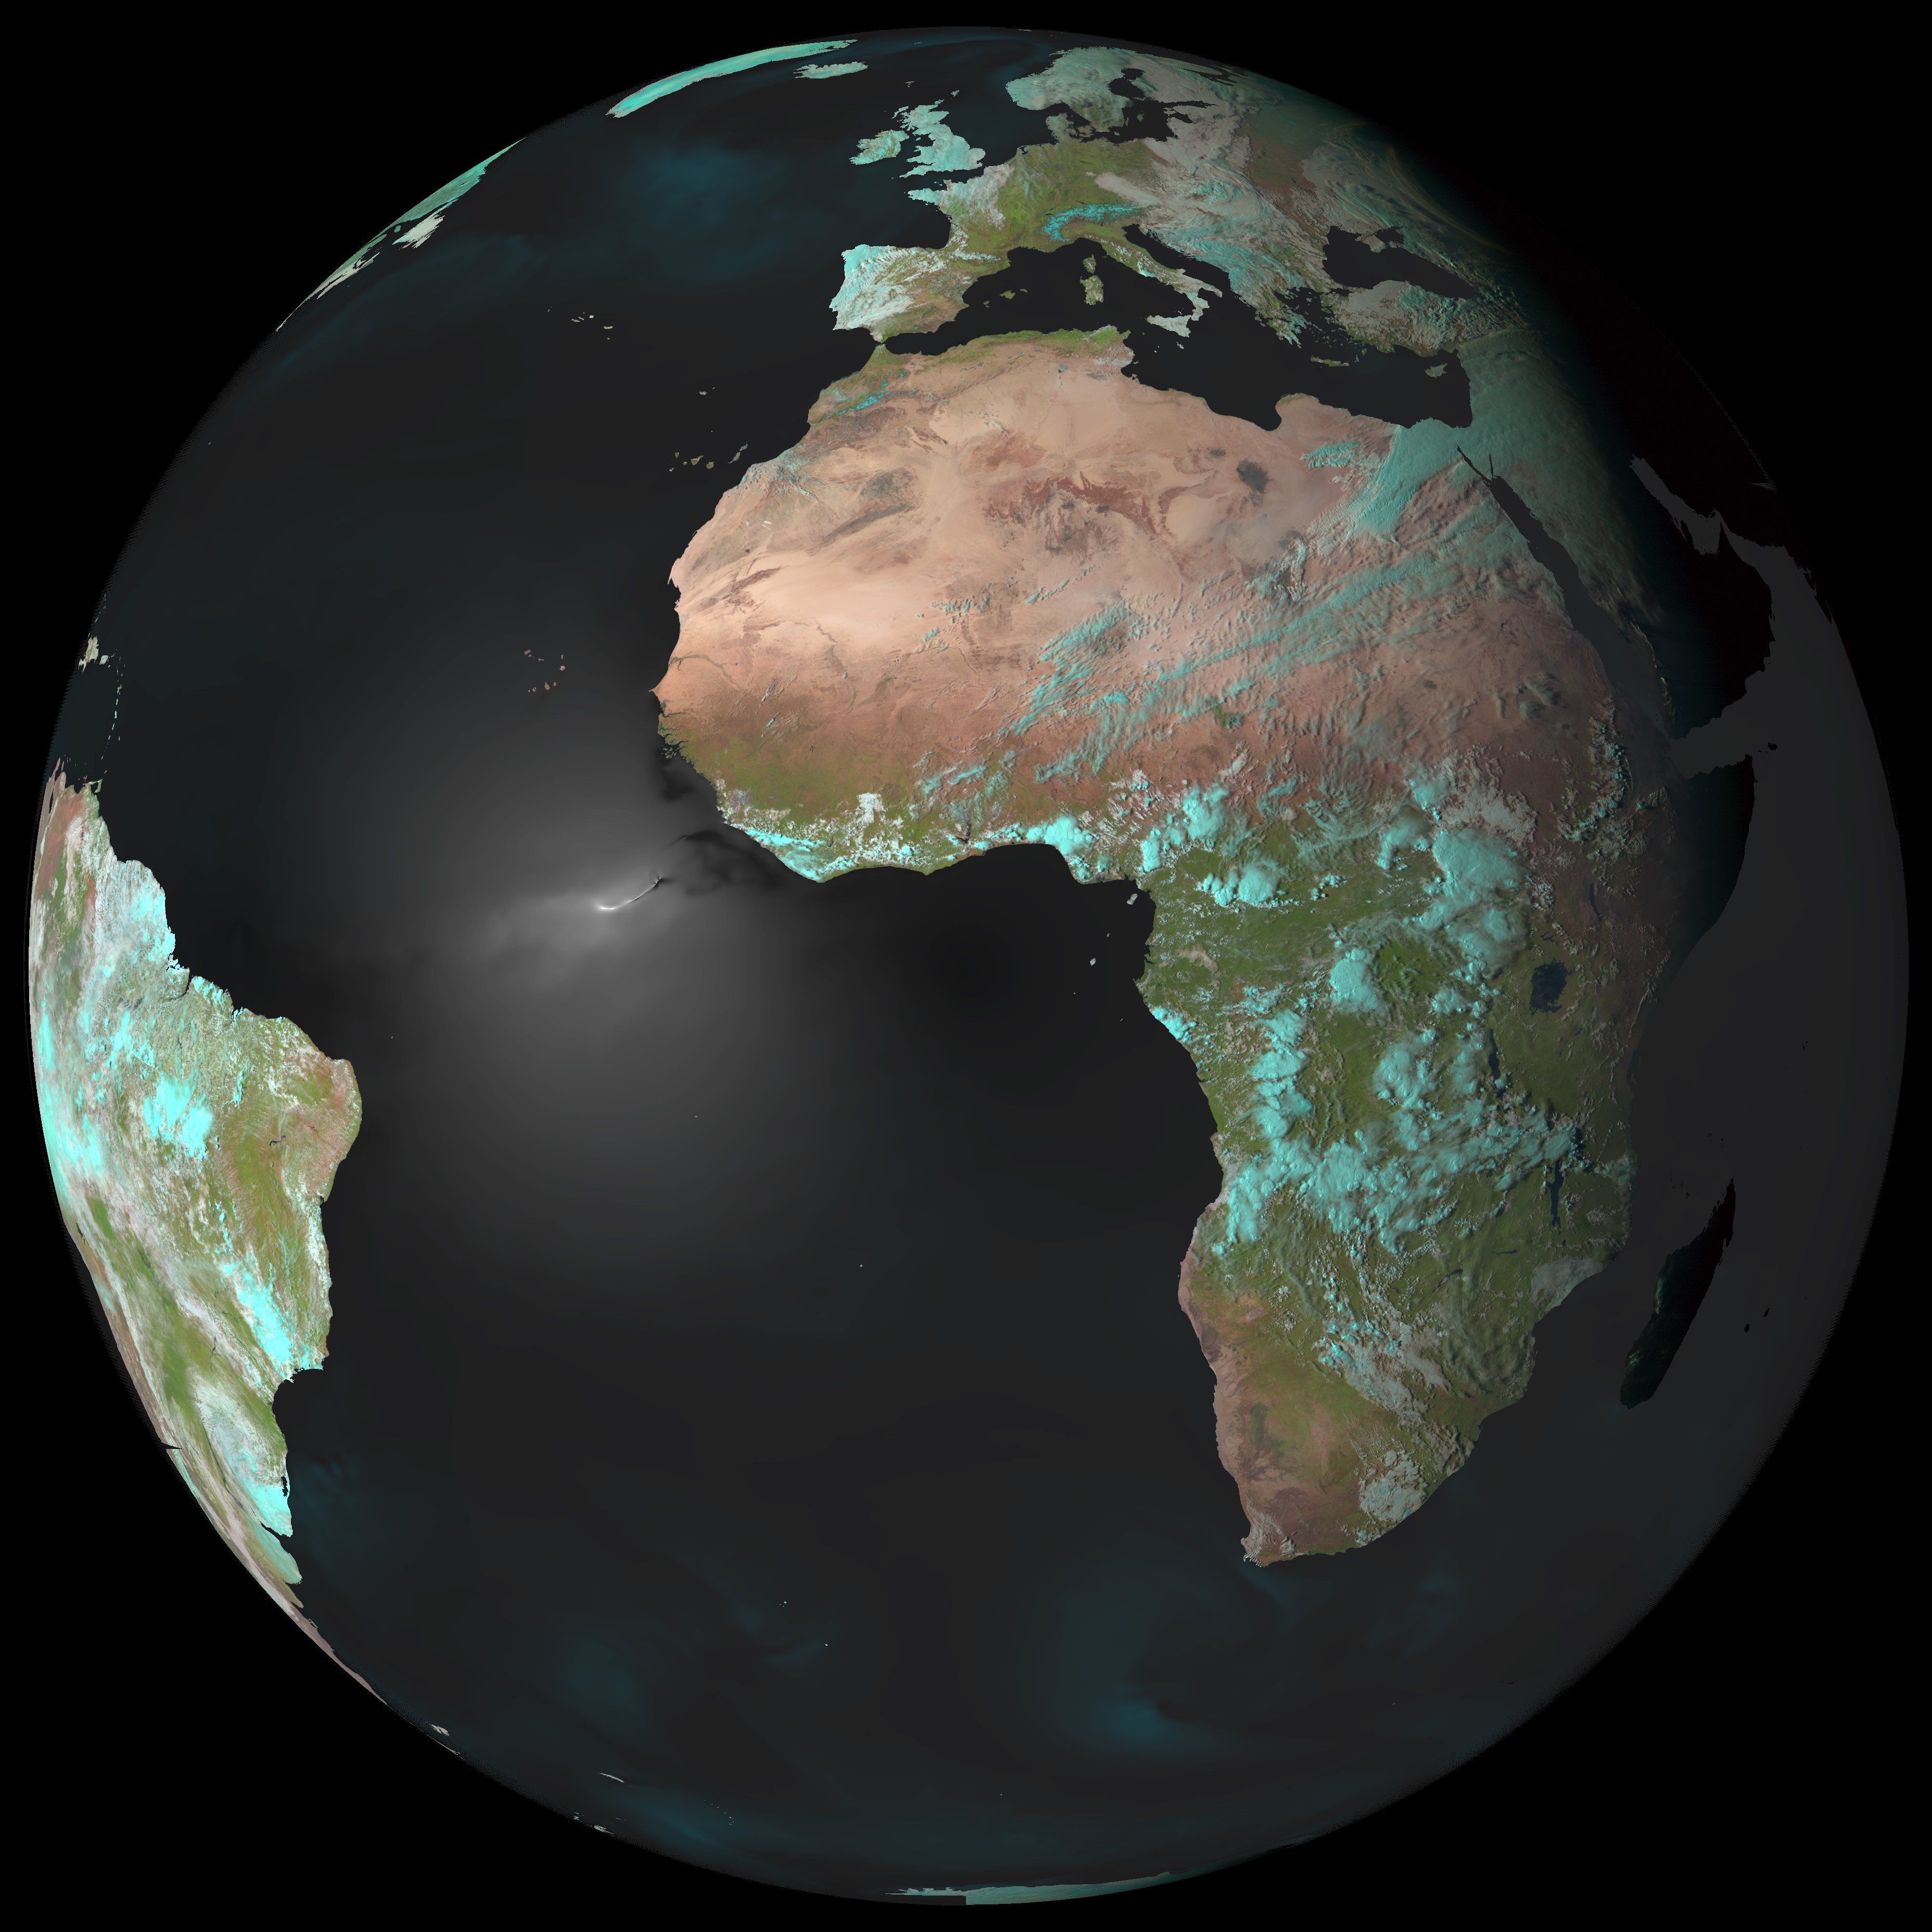
Simulated sea surface reflectance overlaid on a MSG/SEVIRI image. Data: EUMETSAT
Contents: